Making Data Persuasive

One of the best ways to convey a story is by using data.
Hard facts and information always bring an authenticity that no other can provide. It is through these that we are able to achieve excellent articles that give an articulated commentary on our status quo.
But what makes these so persuasive? Let’s take a look.
Visium describes data narratives as “a powerful methodology used to communicate insights and information from data in a compelling and engaging way by constructing a narrative around it.” Essentially taking the data collected and turning it into a story.
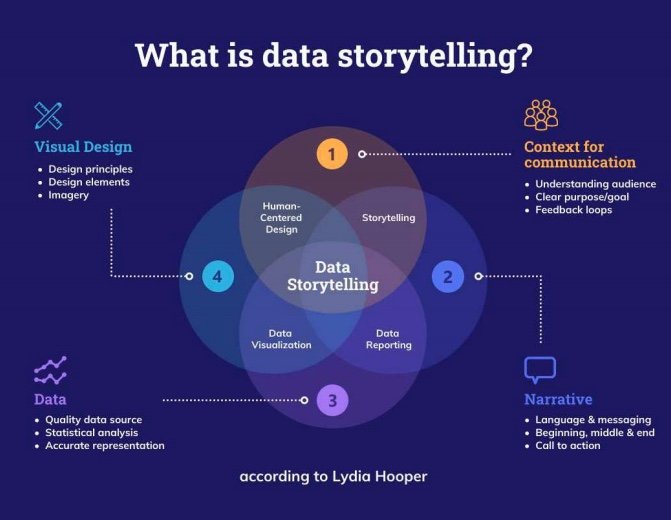
Photo via Venngage
Let’s say that a company wanted to investigate more about problems with their supply chain. They could follow the entire process from the first components to shipping the final product.
By taking this data and visualizing it to find where marketable slowdowns are, the business could address those problems or any problem within it. It could create a story revolving around the gains that one could make through fixing these issues.
It allows everyone from the warehouse managers to the stakeholders to understand exactly what is going on, all through the ways you craft your story. That’s what data narratives are.
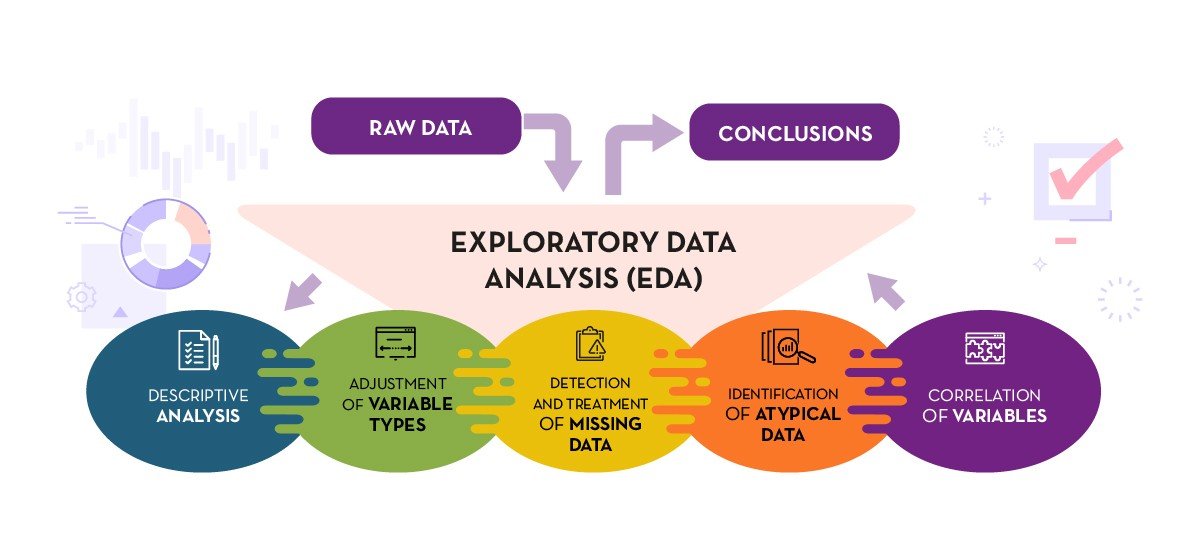
Photo via Datos.gob.es
One of the best ways to convey these insights is through Exploratory Data Analysis (EDA), which is used to “analyze the data and discover trends and patterns or check assumptions in data with the help of statistical summaries and graphical representations.”
With this, we are able to start seeing what makes these so persuasive. These types of narratives are taking concrete data that has been collected, and formulate a story around it.
It takes something that might be complicated on the surface and translates it into actionable steps or processes that can be built upon or taken to use further in the future.
It’s making data easy for everyone.
Once the confusion or inaccessibility of data is removed, it allows insights to be better determined, and give the wide range of people to take something away from it.
Data, in reality, isn’t for everyone. It’s confusing and often difficult to understand, even in a visualized form. Though, when we develop a story around the conclusions from the data, and take that forward, we allow anyone to be part of the data, even if your not an expert.
The Government of Spain. (2021, September 22). A practical introductory guide to exploratory data analysis. https://datos.gob.es/en/documentacion/practical-introductory-guide-exploratory-data-analysis
Hooper, L. (2023, April 25). Data storytelling: How to tell a story with data. Venngage. https://venngage.com/blog/data-storytelling/
Visium. (n.d.). Data storytelling: The power of narrative in Data Analysis. LinkedIn. https://www.linkedin.com/pulse/data-storytelling-power-narrative-analysis-visium-sa